Get In Touch
10/A, Indira Gandhi Street, Sengeniammal Nagar,
Orlean Pet, Pondicherry – 605005. (INDIA)
Work Inquiries
venki@venkidesigns.com
Ph: +91.994.440.0361
STRATEGY | UI/UX | WEB APP

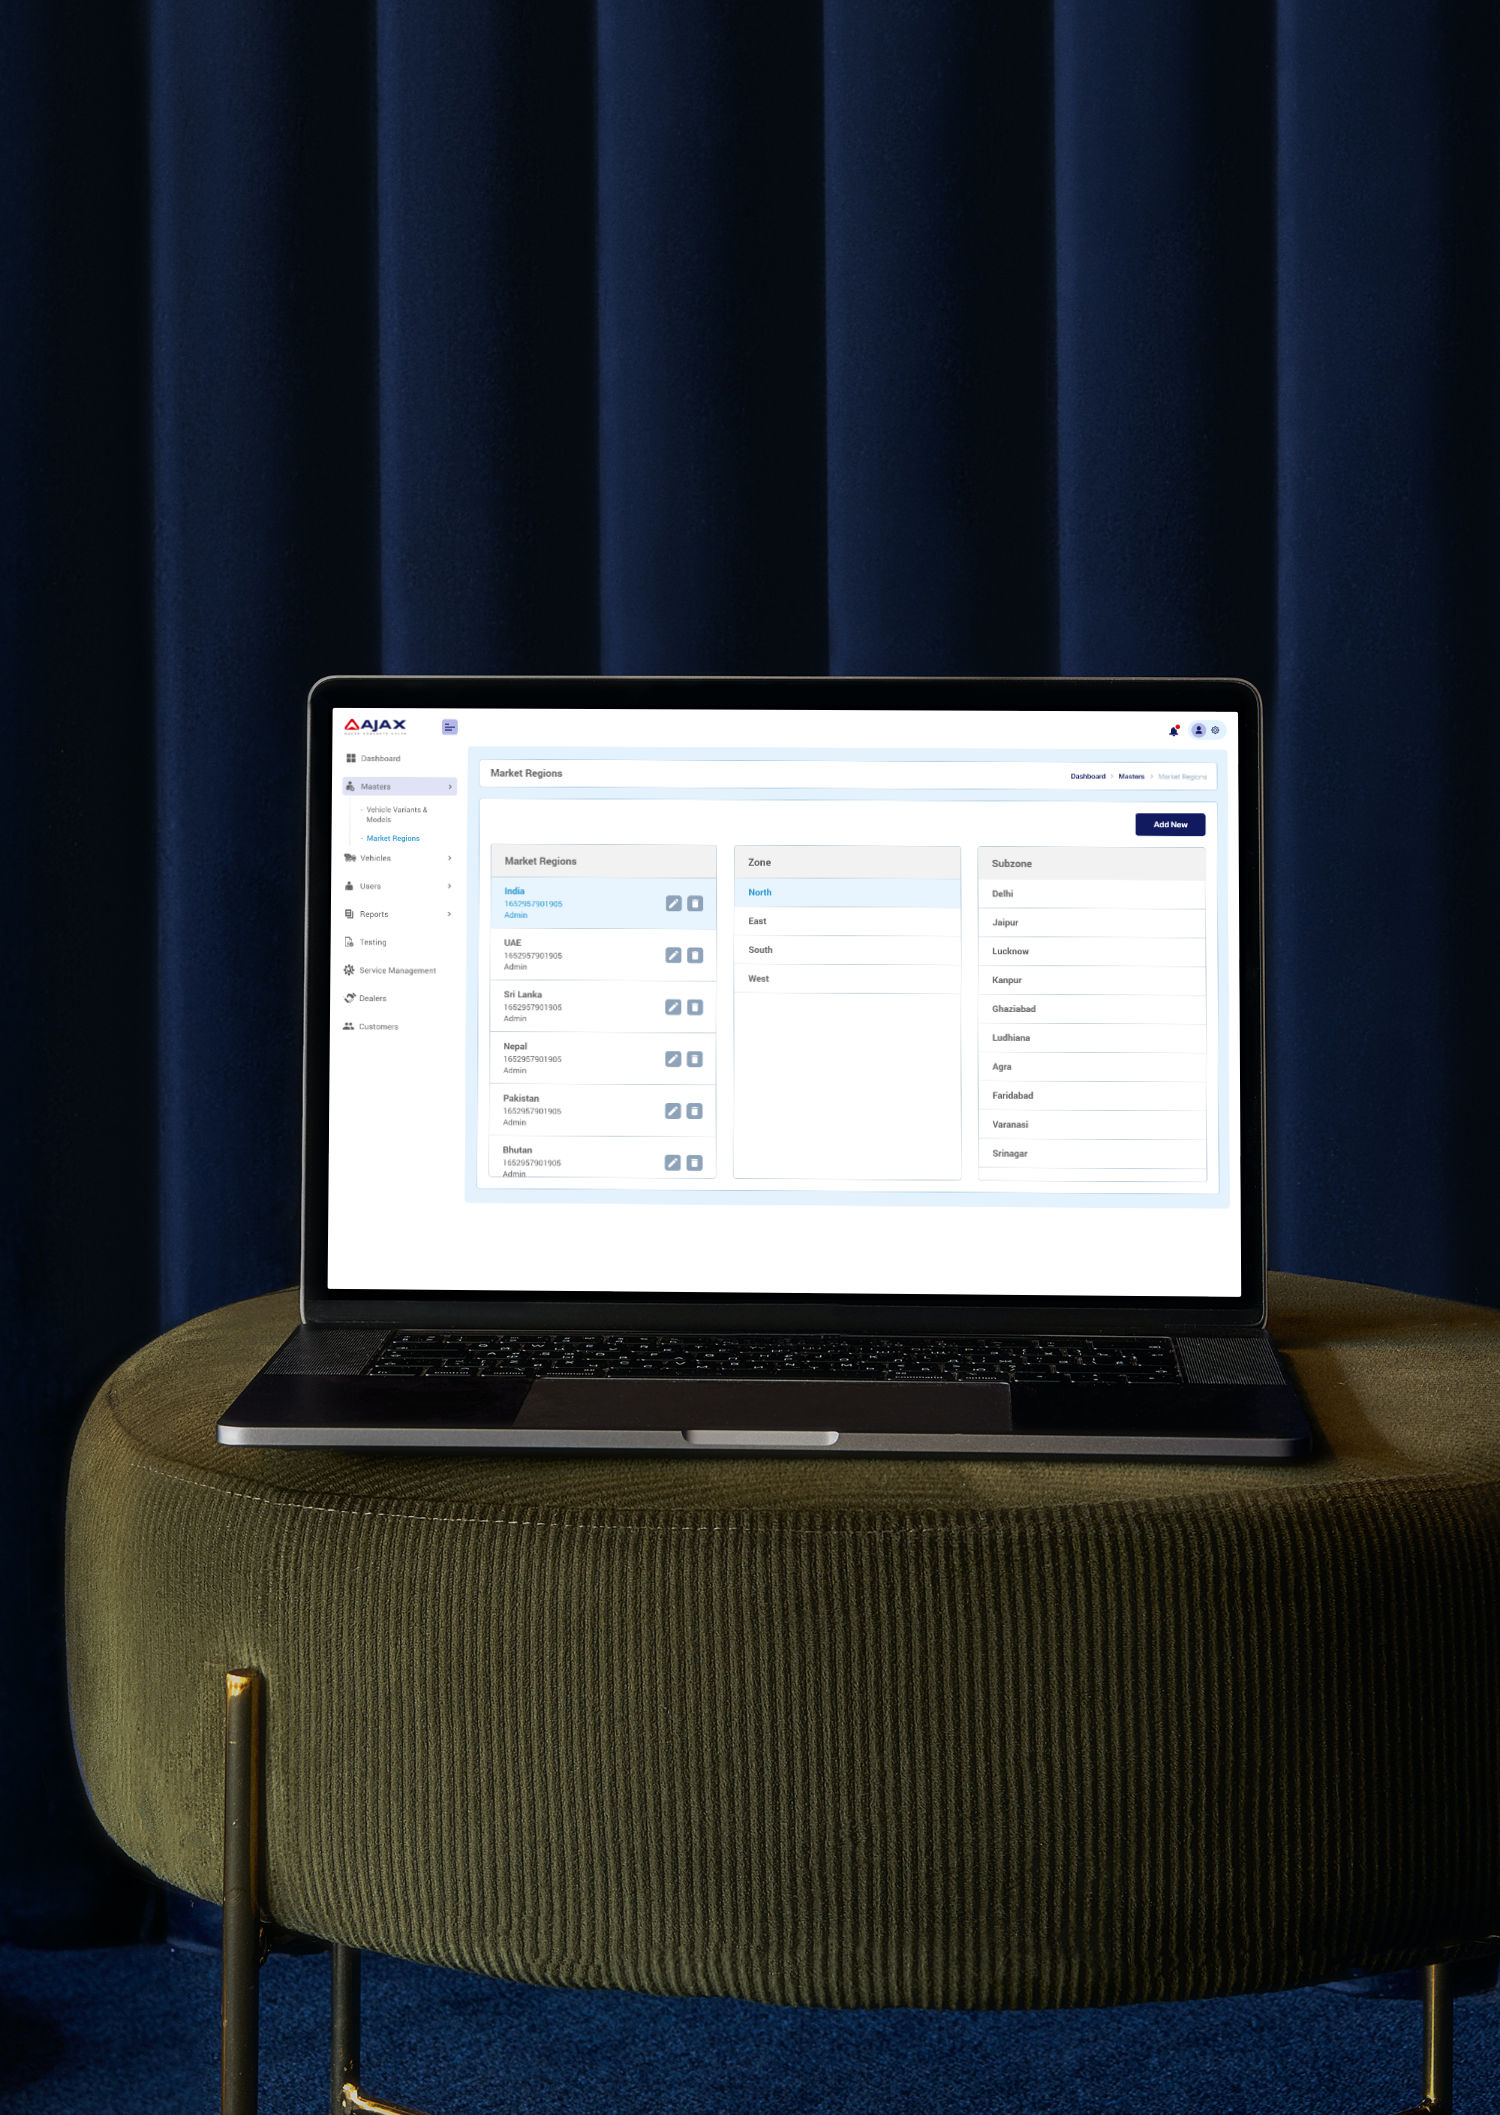
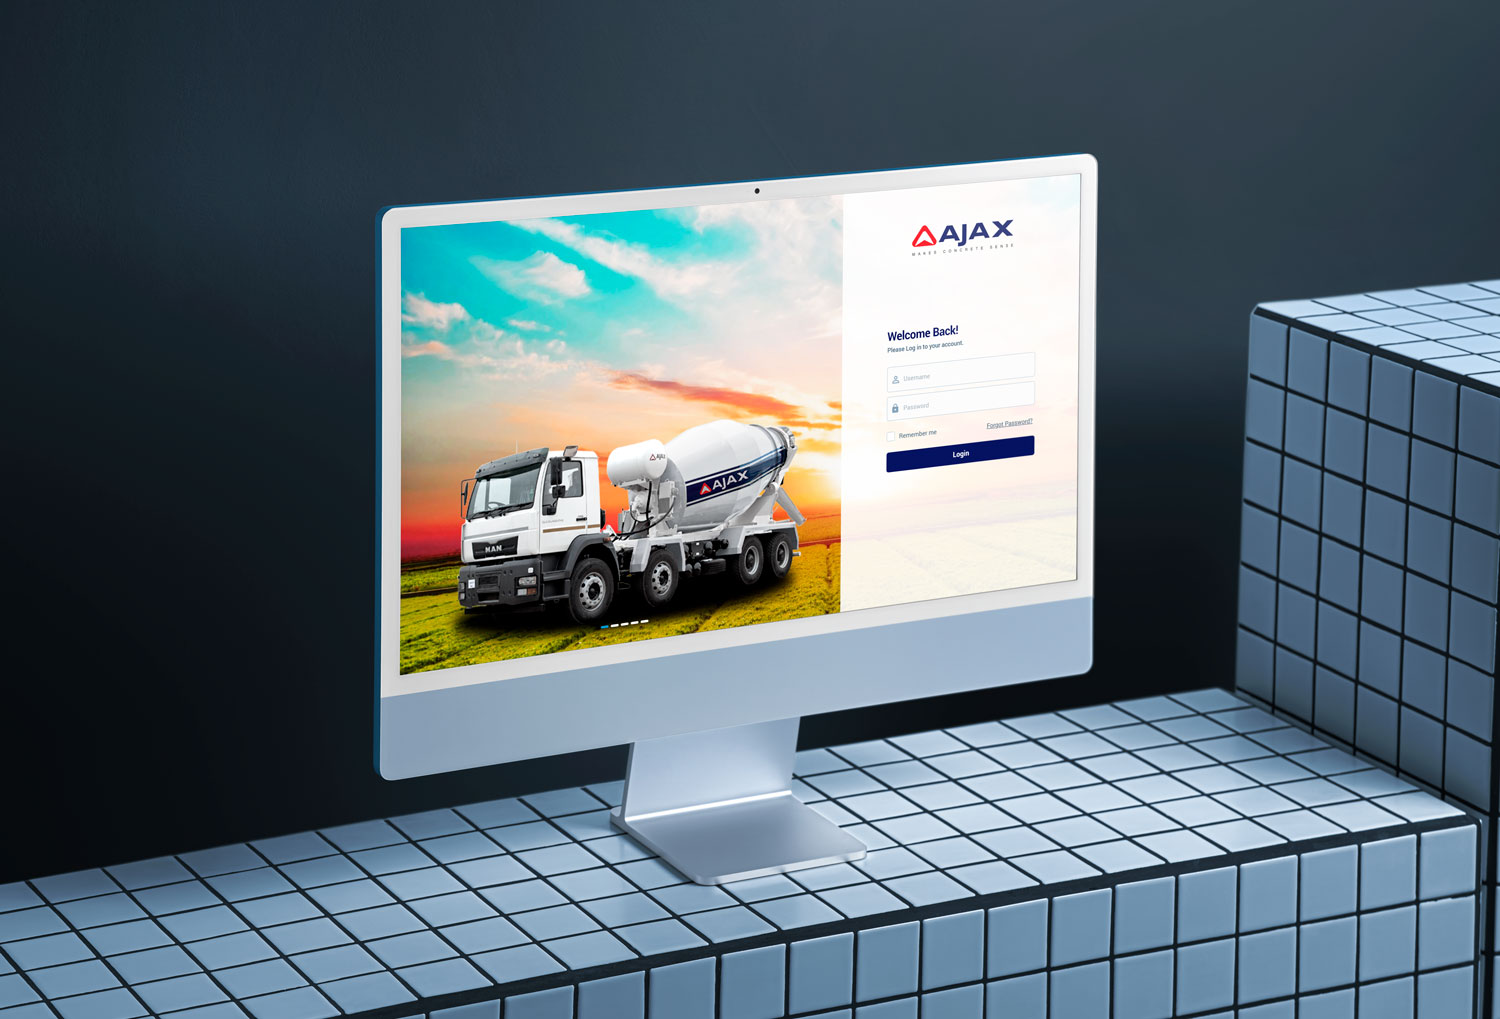
Commercial Vehicle Service Monitoring System Application

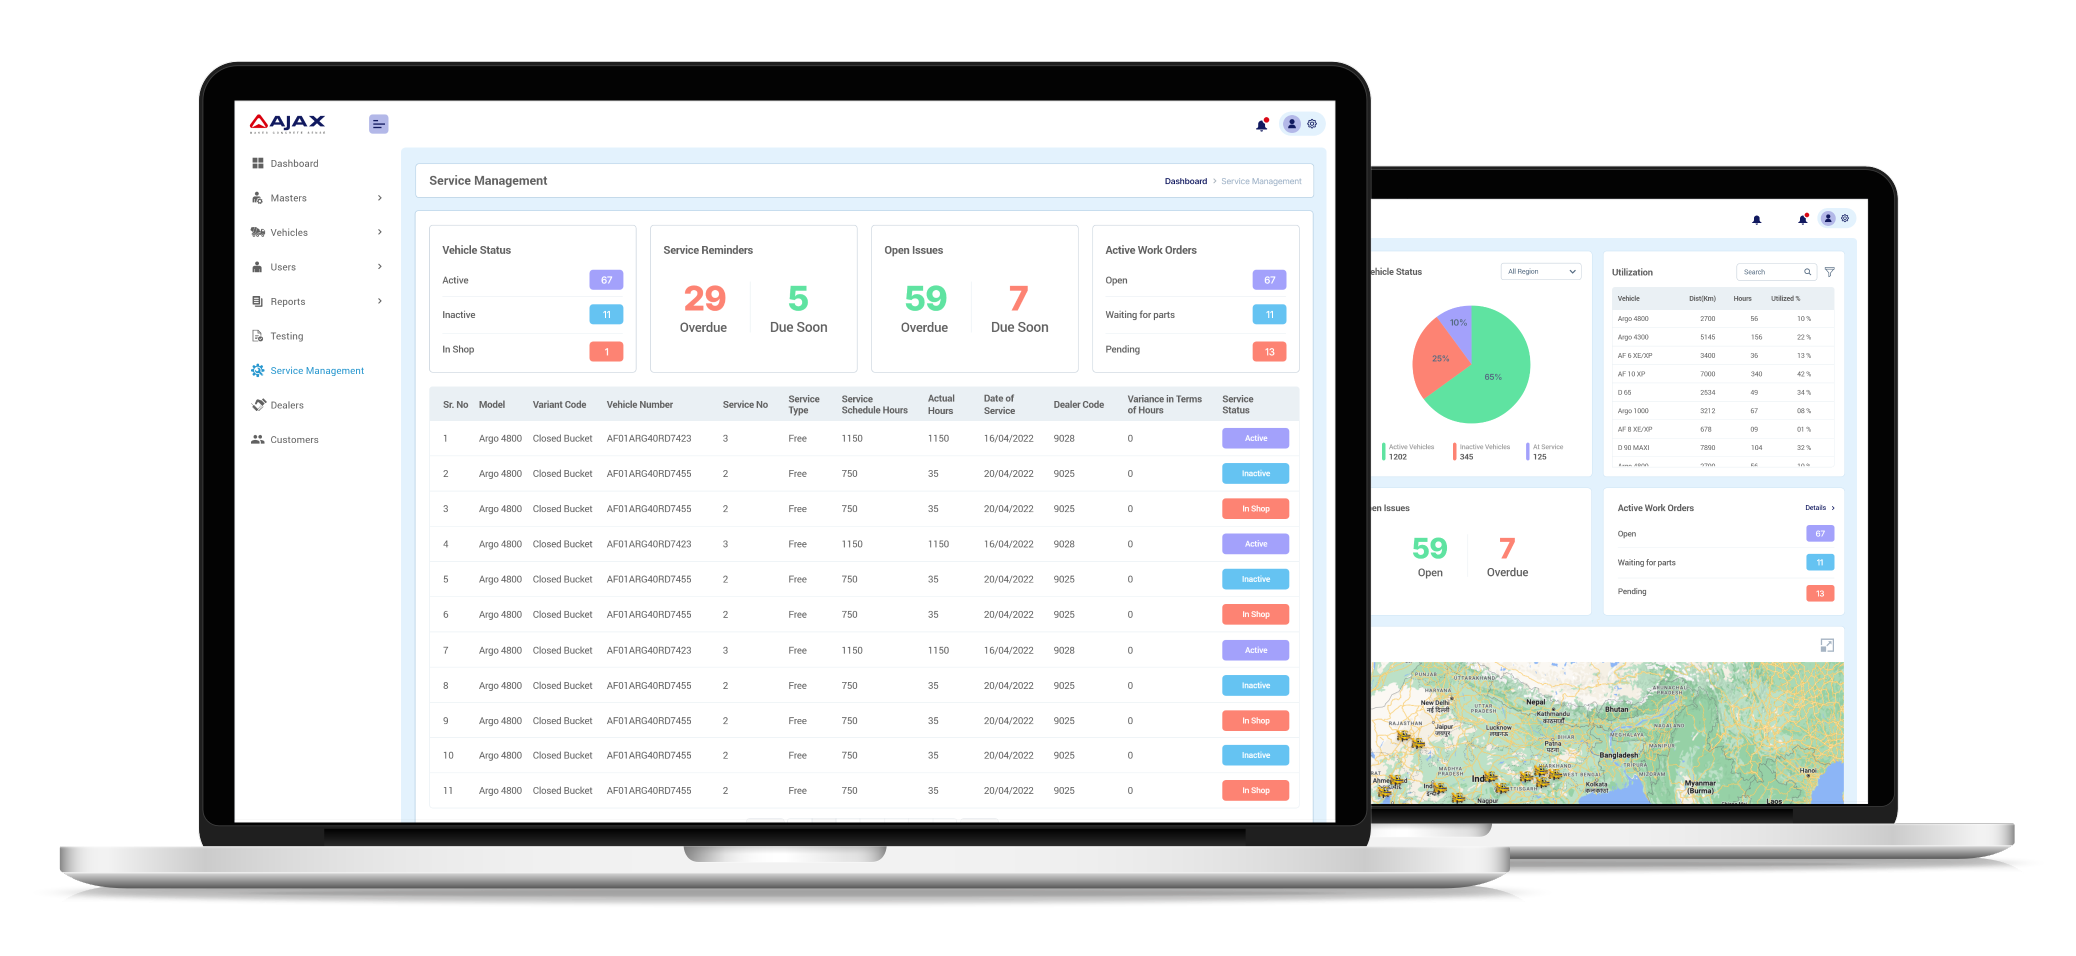
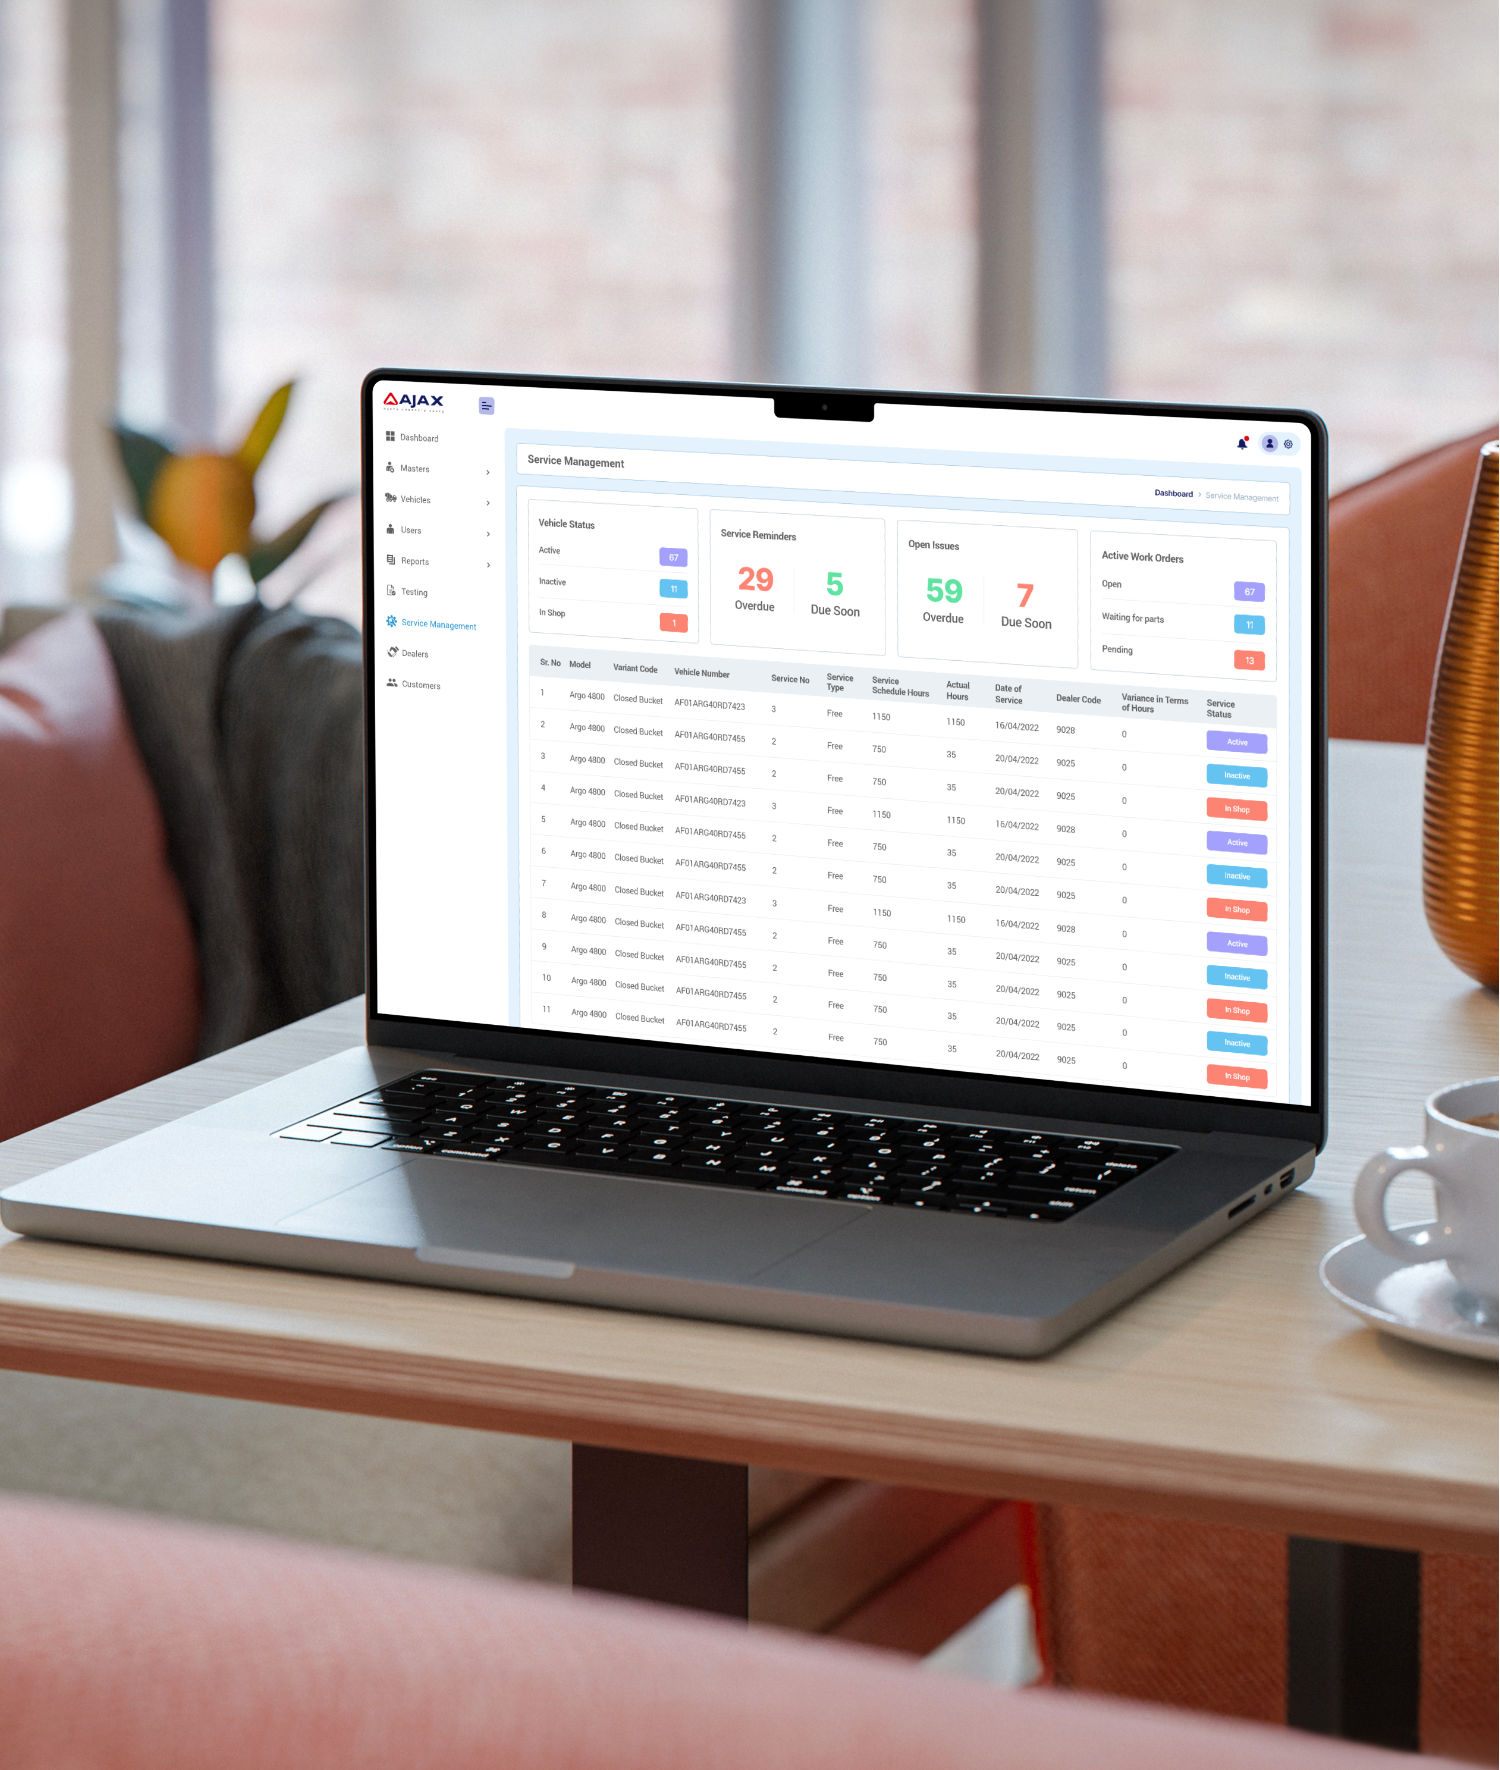
The Commercial Vehicle Service Monitoring System is a cloud-based telematics platform that bridges the gap between raw vehicle data and actionable maintenance insights. By integrating IoT (Internet of Things) sensors, OBD-II (On-Board Diagnostics) trackers, and a centralized management dashboard, the application minimizes vehicle downtime, reduces unexpected repair costs, and ensures compliance with commercial transport safety regulations.

vehicle-monitoring-04a

Core Modules & Features

The application is divided into three primary modules tailored to different users within the fleet operation ecosystem:

  • Predictive Maintenance Engine: Uses machine learning to analyze historical failure rates and real-time engine telemetry (temperature, oil pressure, RPMs) to predict part failures before they happen.

  • Real-Time Geolocation Tracking: Live GPS mapping with geofencing alerts for route deviation or unauthorized stops.

  • Compliance & Logbook Automation: Automatically tracks Hours of Service (HOS) and electronic logging device (ELD) compliance to prevent regulatory fines.

  • Cost Analytics: Dashboards tracking fuel consumption, repair expenditures, and total cost of ownership (TCO) per vehicle.

vehicle-monitoring-05

Problem Statement

Commercial fleet operators traditionally rely on reactive maintenance and manual record-keeping, leading to severe operational inefficiencies. Without real-time visibility into the mechanical health of vehicles on the road, minor, easily repairable faults often escalate into catastrophic, mid-route engine failures. This lack of preventative oversight creates a cascade of logistical and financial challenges for transport businesses.

Core Pain Points

To design an effective solution, the interface must address these specific friction points:

  • Unplanned Downtime: Vehicles breaking down mid-route disrupt supply chains, cause missed delivery SLAs (Service Level Agreements), and incur expensive emergency towing and spot-repair costs.

  • Data Silos and Blind Spots: Fleet managers have no immediate insight into critical telemetry (engine temperature, oil pressure, diagnostic trouble codes, or tire pressure) until a driver manually reports an issue or a physical breakdown occurs..

  • Inefficient Maintenance Scheduling: Relying on fixed calendar intervals or generic mileage markers rather than actual vehicle condition leads to both over-servicing (wasting shop hours) and under-servicing (risking failure).

  • Compliance and Safety Risks: Manual, paper-based pre-trip and post-trip inspections (DVIRs) are prone to “pencil-whipping” (falsification without actual inspection) or human error, risking regulatory fines and placing unsafe heavy vehicles on public roads.

Business Impact

The reliance on a break-fix model directly erodes profit margins. Industry data indicates that reactive maintenance costs significantly more per mile than preventative care, largely due to collateral damage (e.g., a failing water pump destroying an entire engine). Furthermore, unexpected breakdowns damage client trust, increase commercial insurance premiums, and accelerate the depreciation of expensive assets.

Core Solution Pillars

A reactive, crisis-driven model to a proactive, automated ecosystem.

1. Real-Time Telemetry and Edge Computing

Instead of waiting for a driver to report an issue or an engine to fail, the system integrates directly with the vehicle’s OBD-II port and CAN bus. It continuously monitors thousands of data points per second—including engine temperature, oil viscosity, battery voltage, and tire pressure. Edge computing within the telematics gateway filters this data, immediately flagging critical Diagnostic Trouble Codes (DTCs) and transmitting them to the cloud via cellular or satellite networks.

2. AI-Driven Predictive Maintenance

The platform eliminates the guesswork of fixed-interval scheduling. The system’s machine learning engine cross-references real-time sensor data against historical failure models and manufacturer benchmarks. If an alternator shows a specific voltage fluctuation pattern known to precede failure, the system flags the component for replacement before it breaks, allowing managers to schedule the repair during planned downtime rather than mid-route.

3. Automated Maintenance Workflows

The solution tears down the silos between the road, the dispatch office, and the mechanic’s bay.

4. Digital Compliance and DVIR Modernization

To resolve the safety and regulatory risks associated with paper logbooks, the solution incorporates a mobile application for drivers. This digitizes the Driver Vehicle Inspection Report (DVIR). Drivers are required to upload photos of visible defects (e.g., bald tires, cracked windshields) via their smartphone, ensuring the inspection was physically completed. This data instantly syncs with the cloud, creating an unalterable audit trail for regulatory compliance (such as FMCSA mandates in North America) and immediately alerting mechanics to physical issues sensors cannot detect.
DEEP UNDERSTANDING

The Users and the Industry

Commercial transport is a high-volume, thin-margin industry where profitability is dictated by asset utilization. An idle truck costs money; a broken-down truck hemorrhages it. Furthermore, the industry operates under immense regulatory scrutiny (such as the FMCSA in North America) and is currently battling severe labor shortages for both qualified commercial drivers and certified diesel mechanics.

A successful Commercial Vehicle Service Monitoring System cannot just be a data pipeline; it must act as a workflow multiplier for the three distinct human personas operating within this ecosystem.

vehicle-monitoring-02
I MADE A

Personas & User Journey Maps

My interviews with the Business Users and Users provided critical, detailed information. This foundation allowed me to successfully create the resulting personas and journey maps.

Personas

Personas

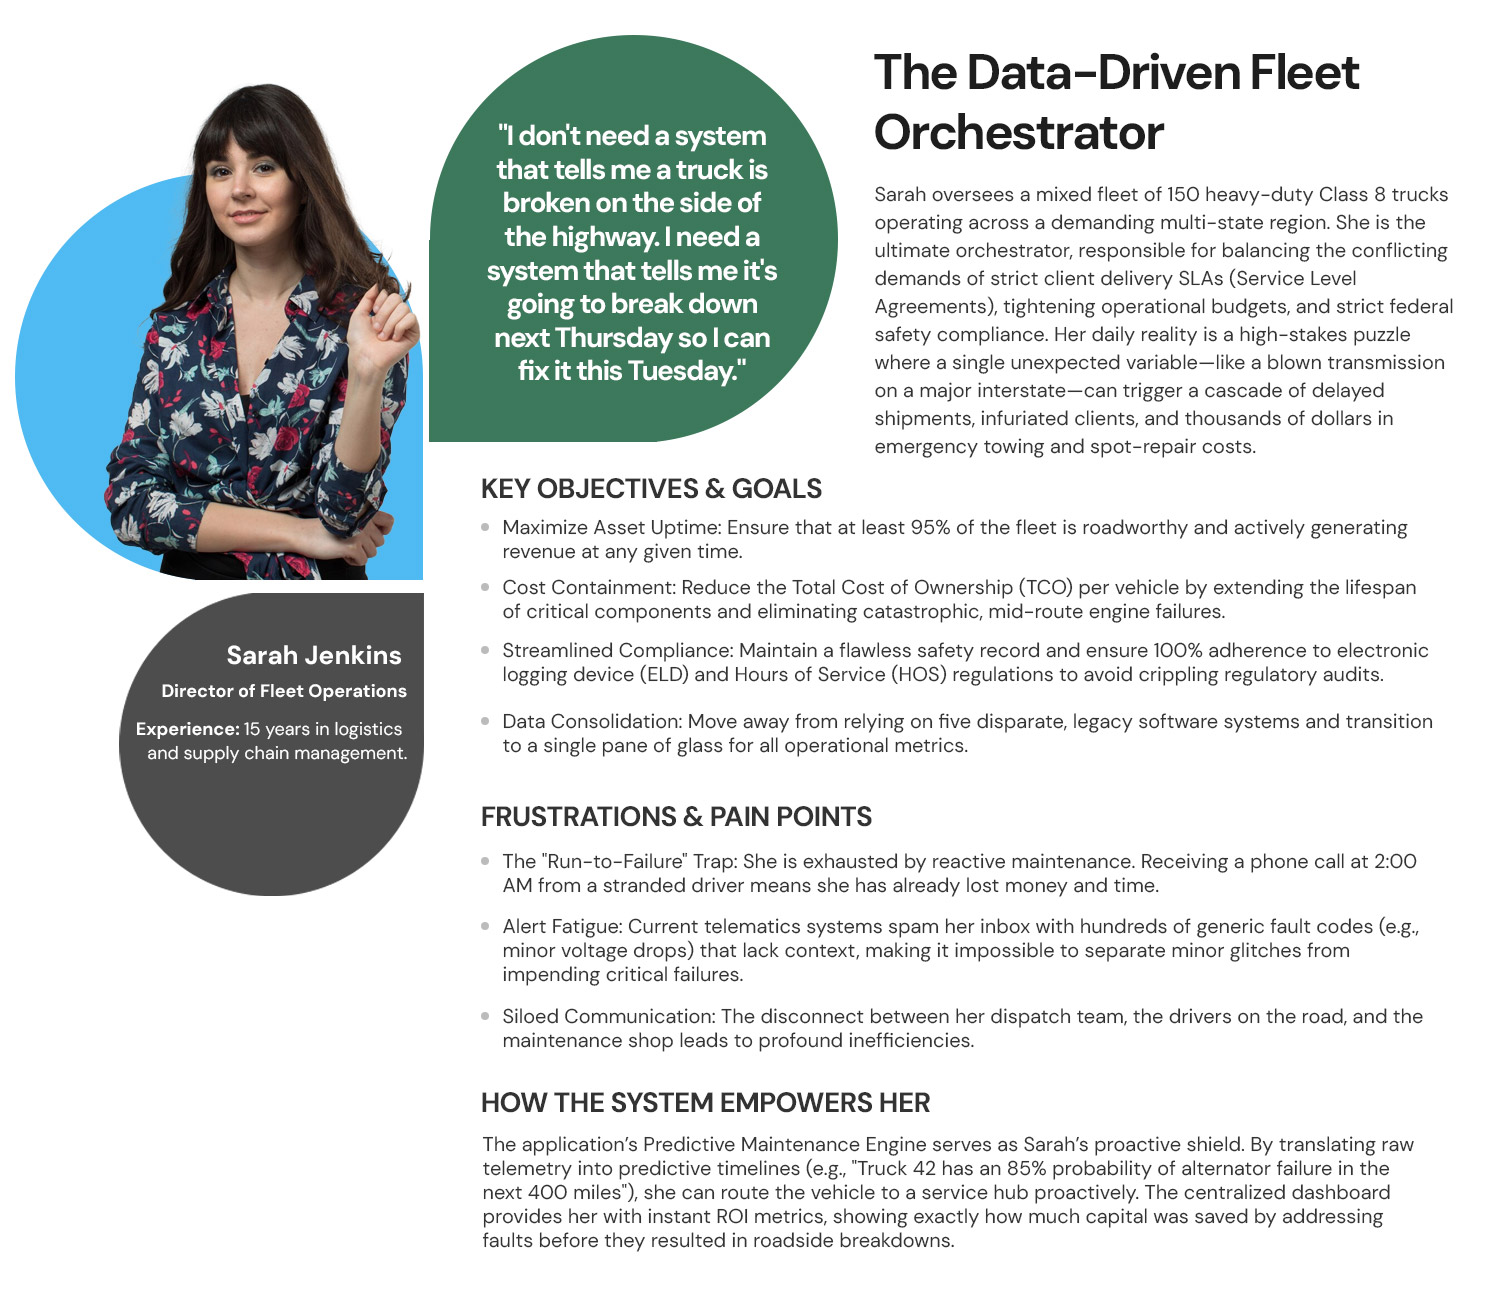
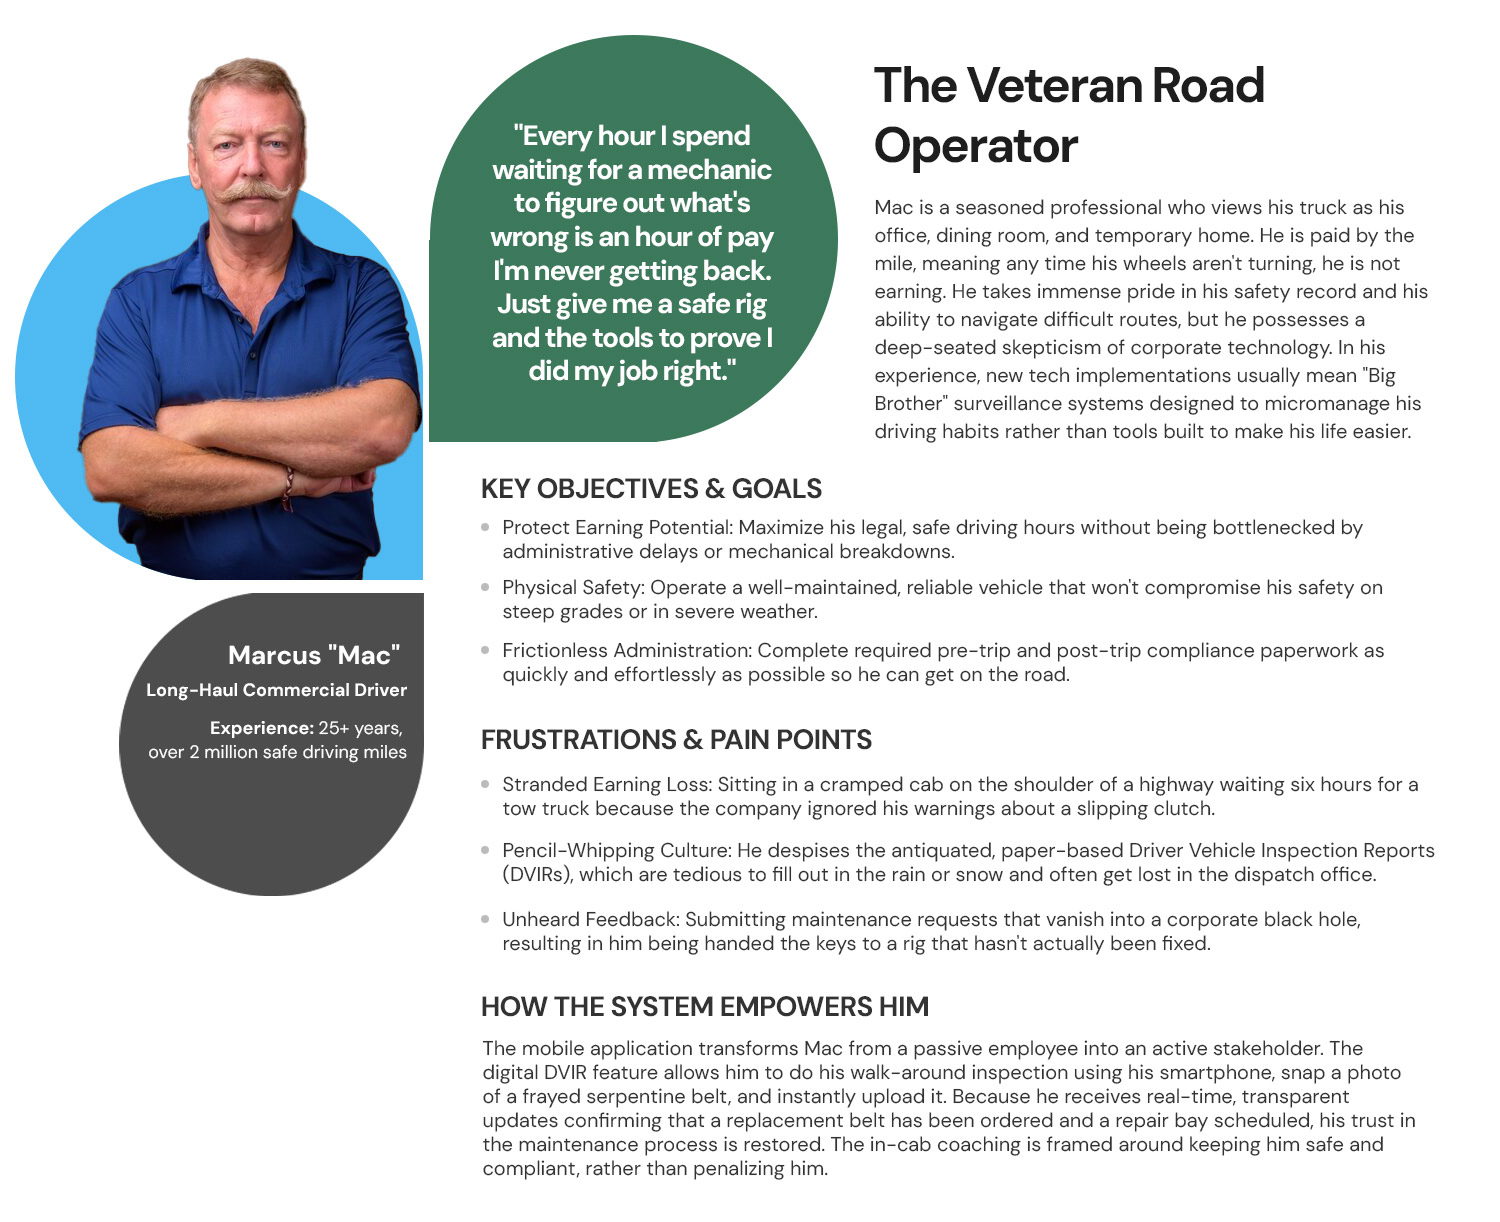
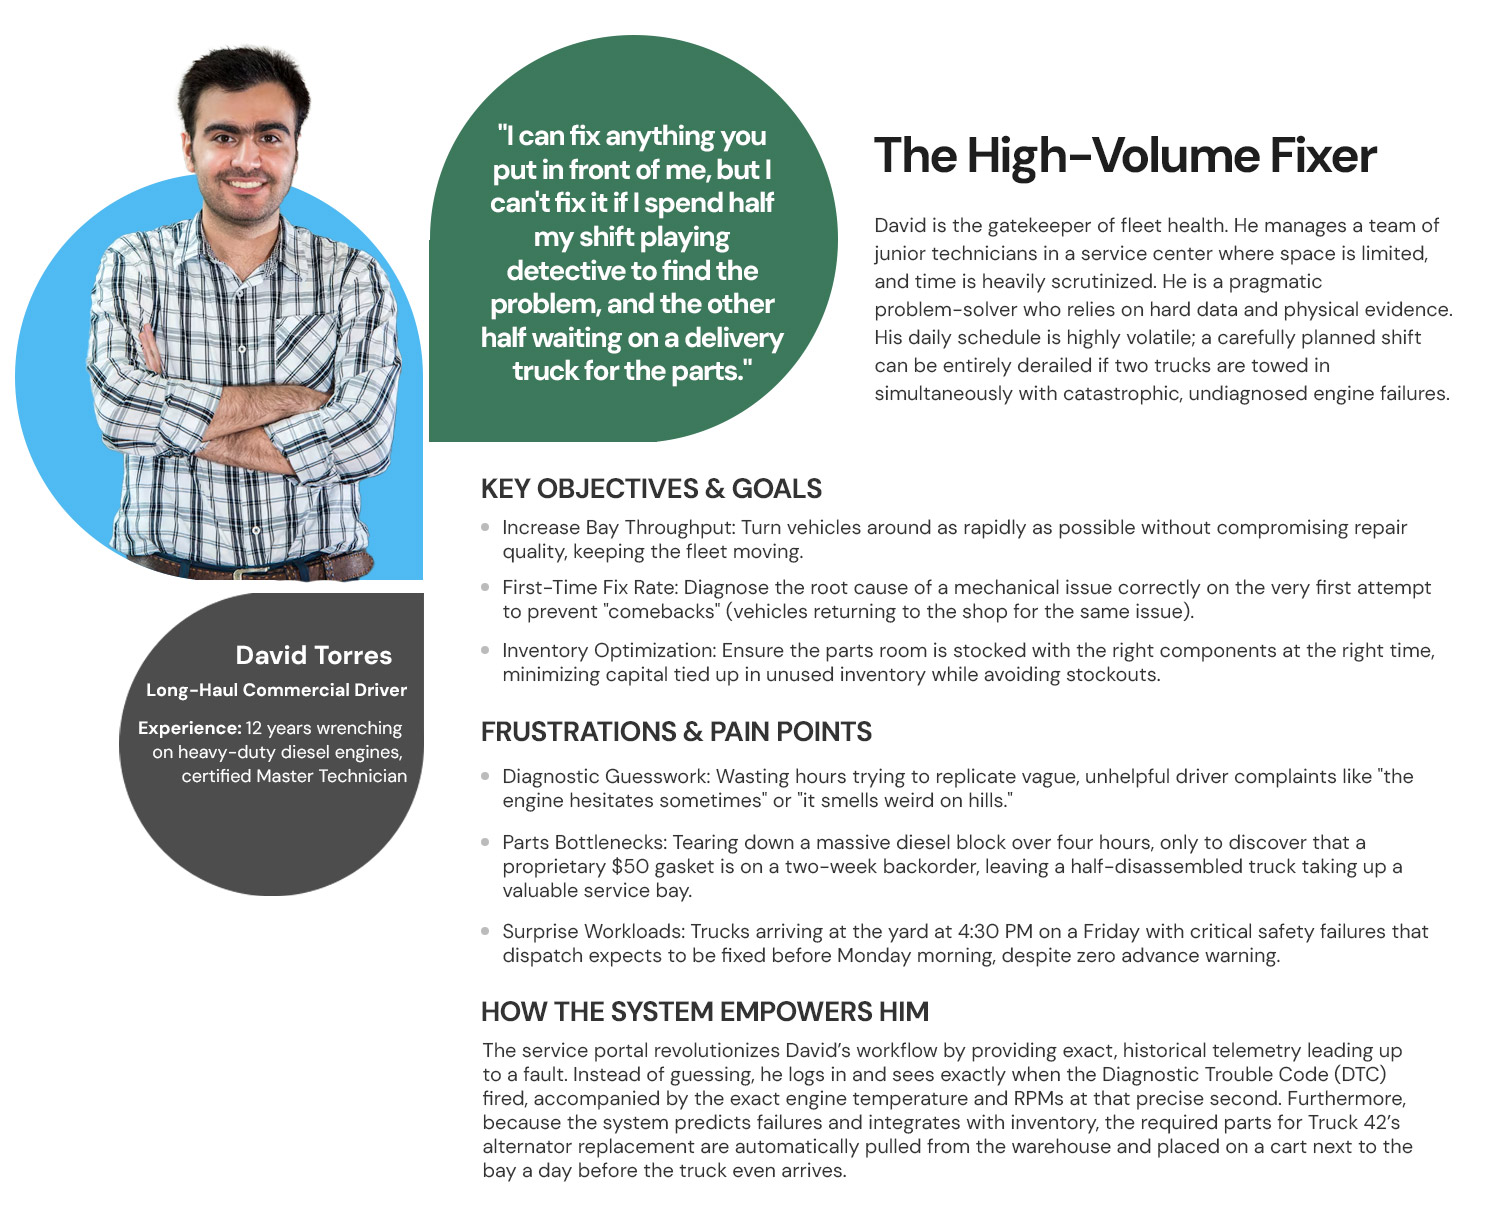
Empathy is the foundation of great design. I develop UX Personas to humanize our target audience, allowing us to step into the user’s shoes. Understanding their ‘why’ helps me design interfaces that don’t just look good, but feel relevant and intuitive to the people using them.

Service-Monitoring-Personas-01
Persona 1: The Data-Driven Fleet Orchestrator
Service-Monitoring-Personas-02
Persona 2: The Veteran Road Operator
Persona 3: The High-Volume Fixer
user-journey-maps

User Journey Maps

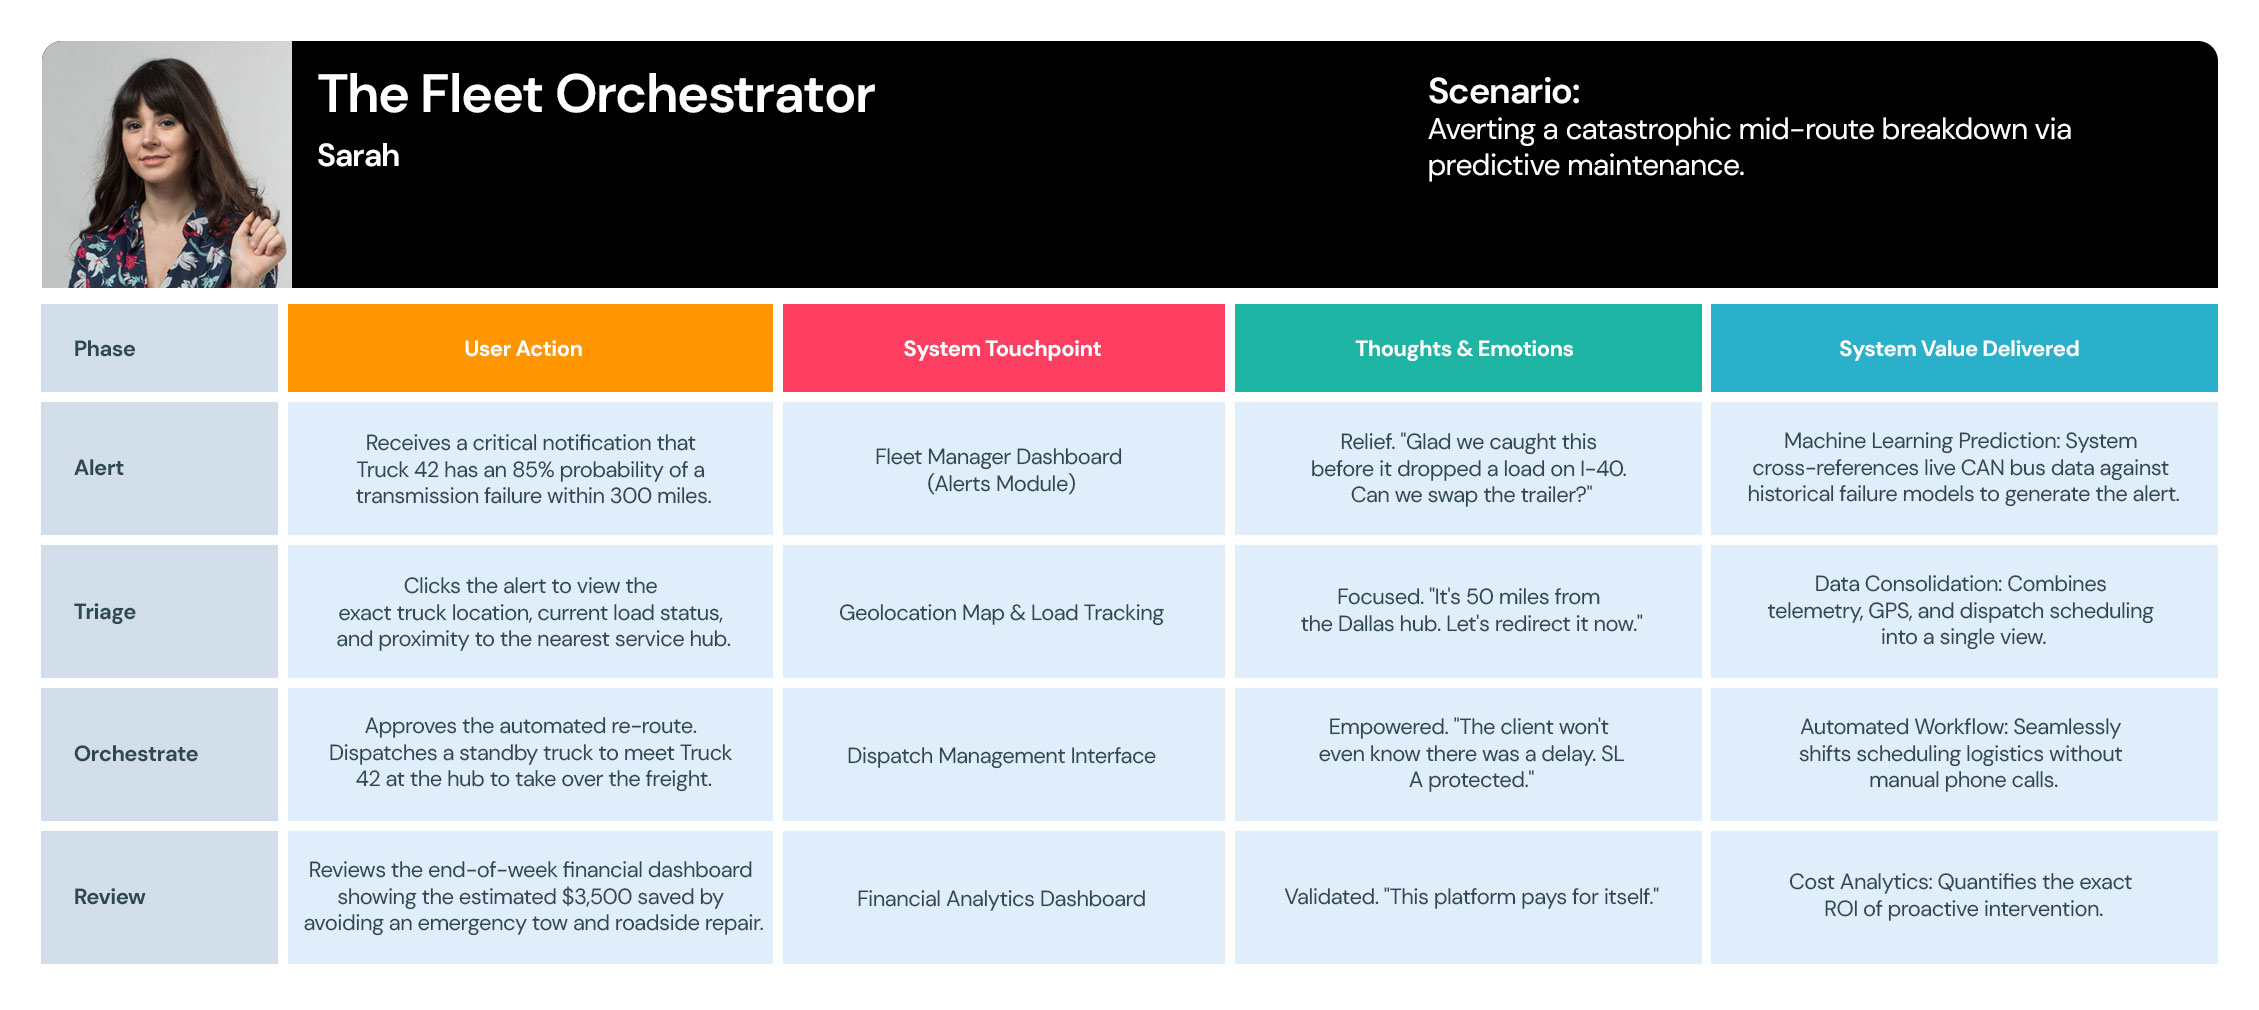
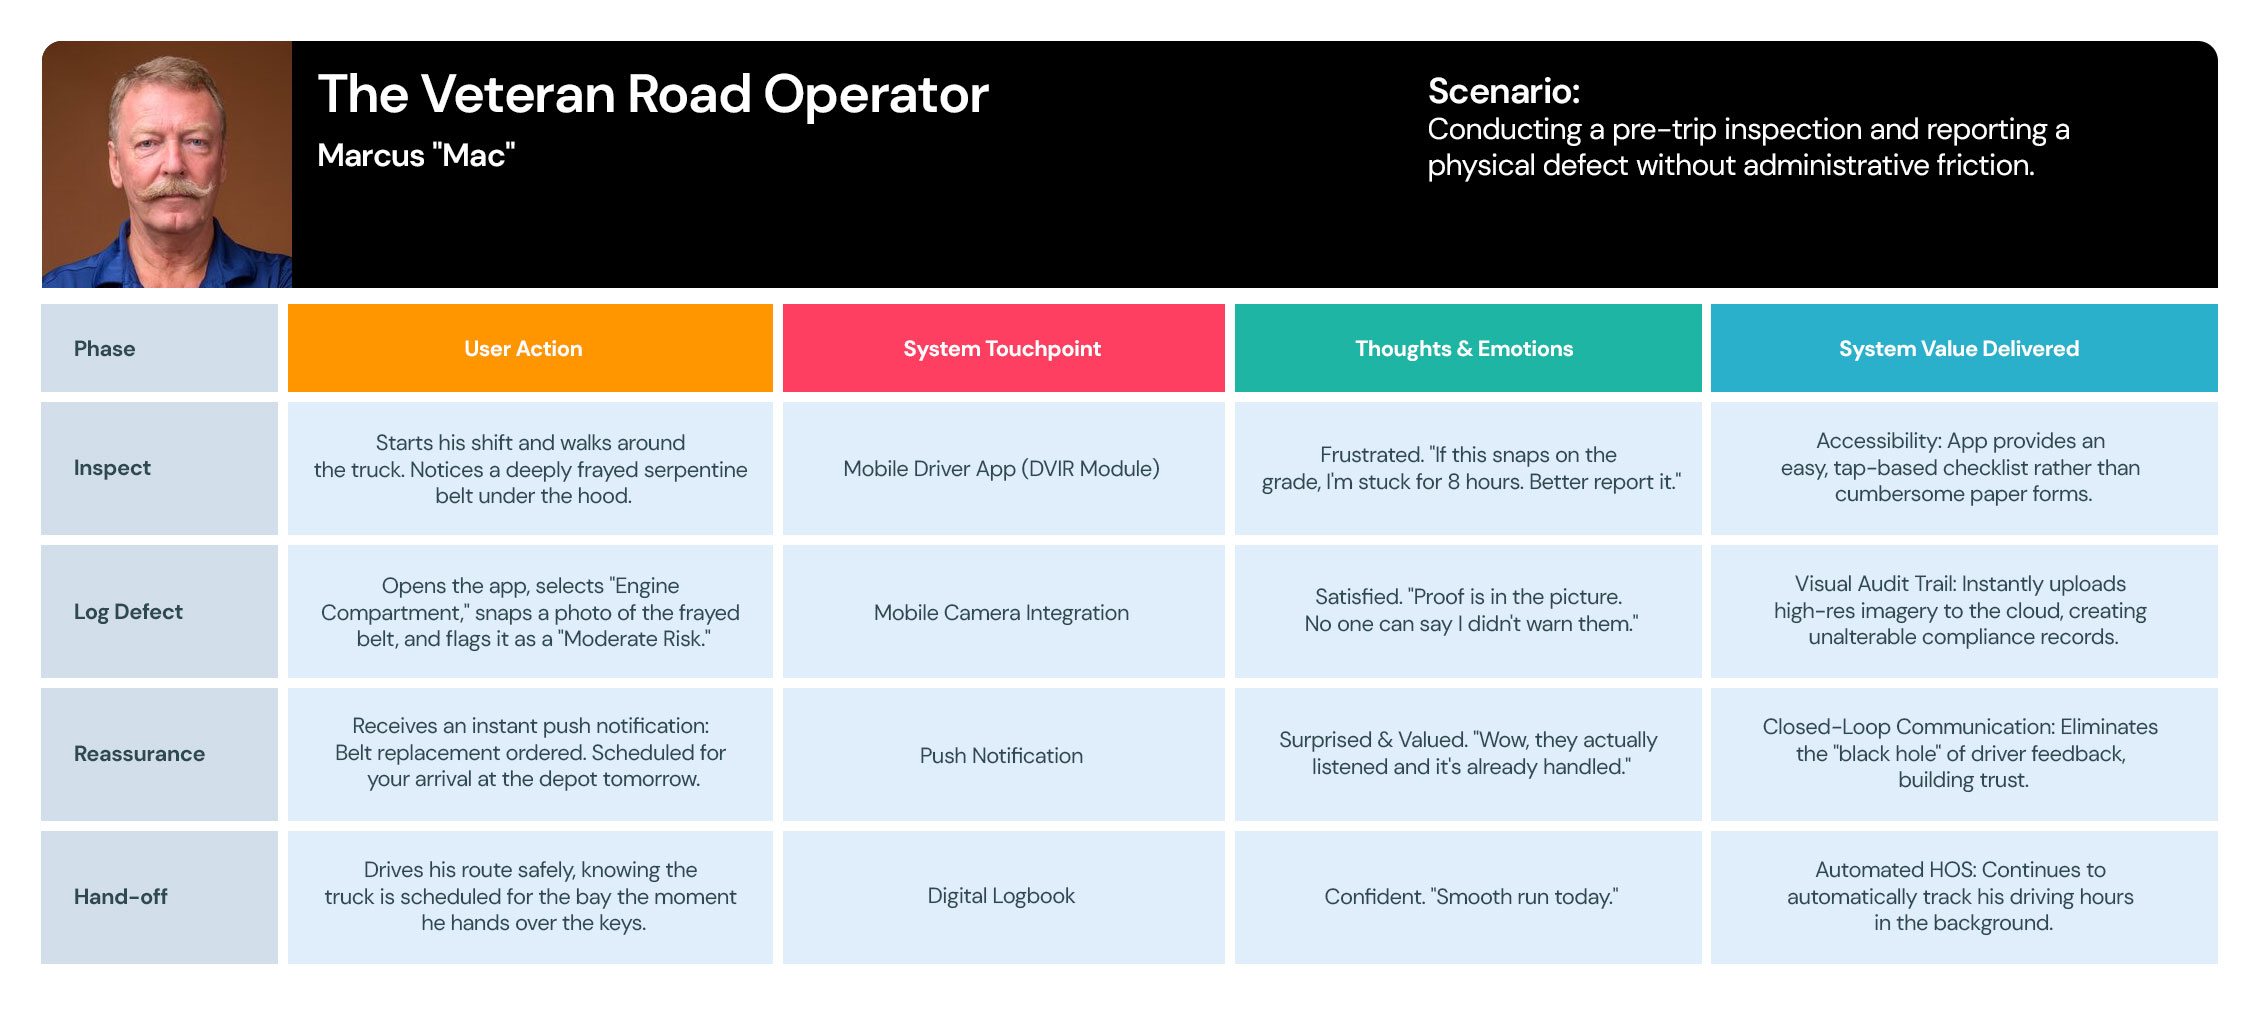
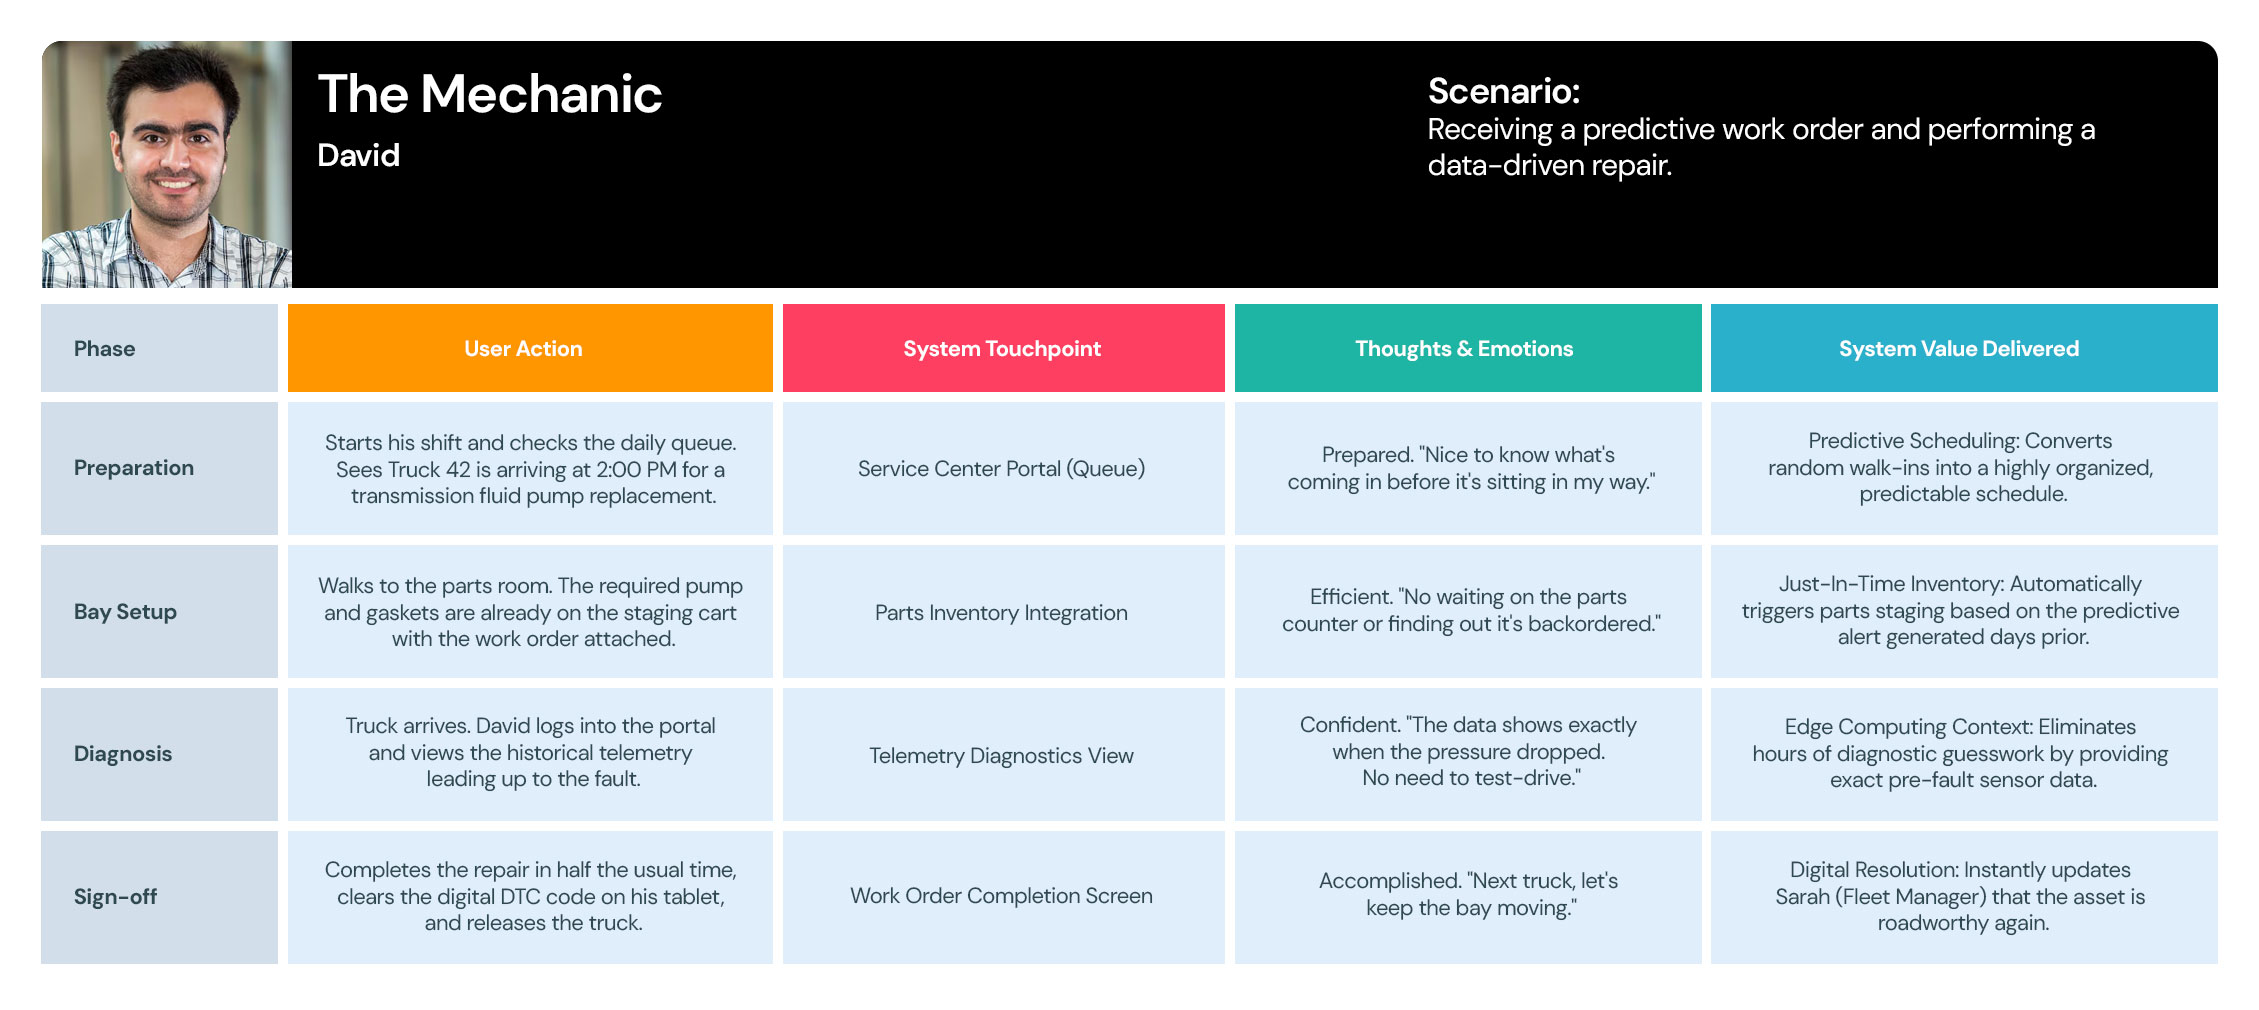
I use User Journey Maps to visualize the end-to-end experience and uncover hidden friction points. By mapping out every touchpoint—from discovery to conversion—I identify where users get frustrated or lose interest. This allows us to turn ‘drop-off points’ into opportunities for engagement.

Service-Monitoring-User-Journey-Maps-01
User Journey 1: The Fleet Orchestrator
User Journey 2: The Veteran Road Operator
User Journey 3: The Mechanic

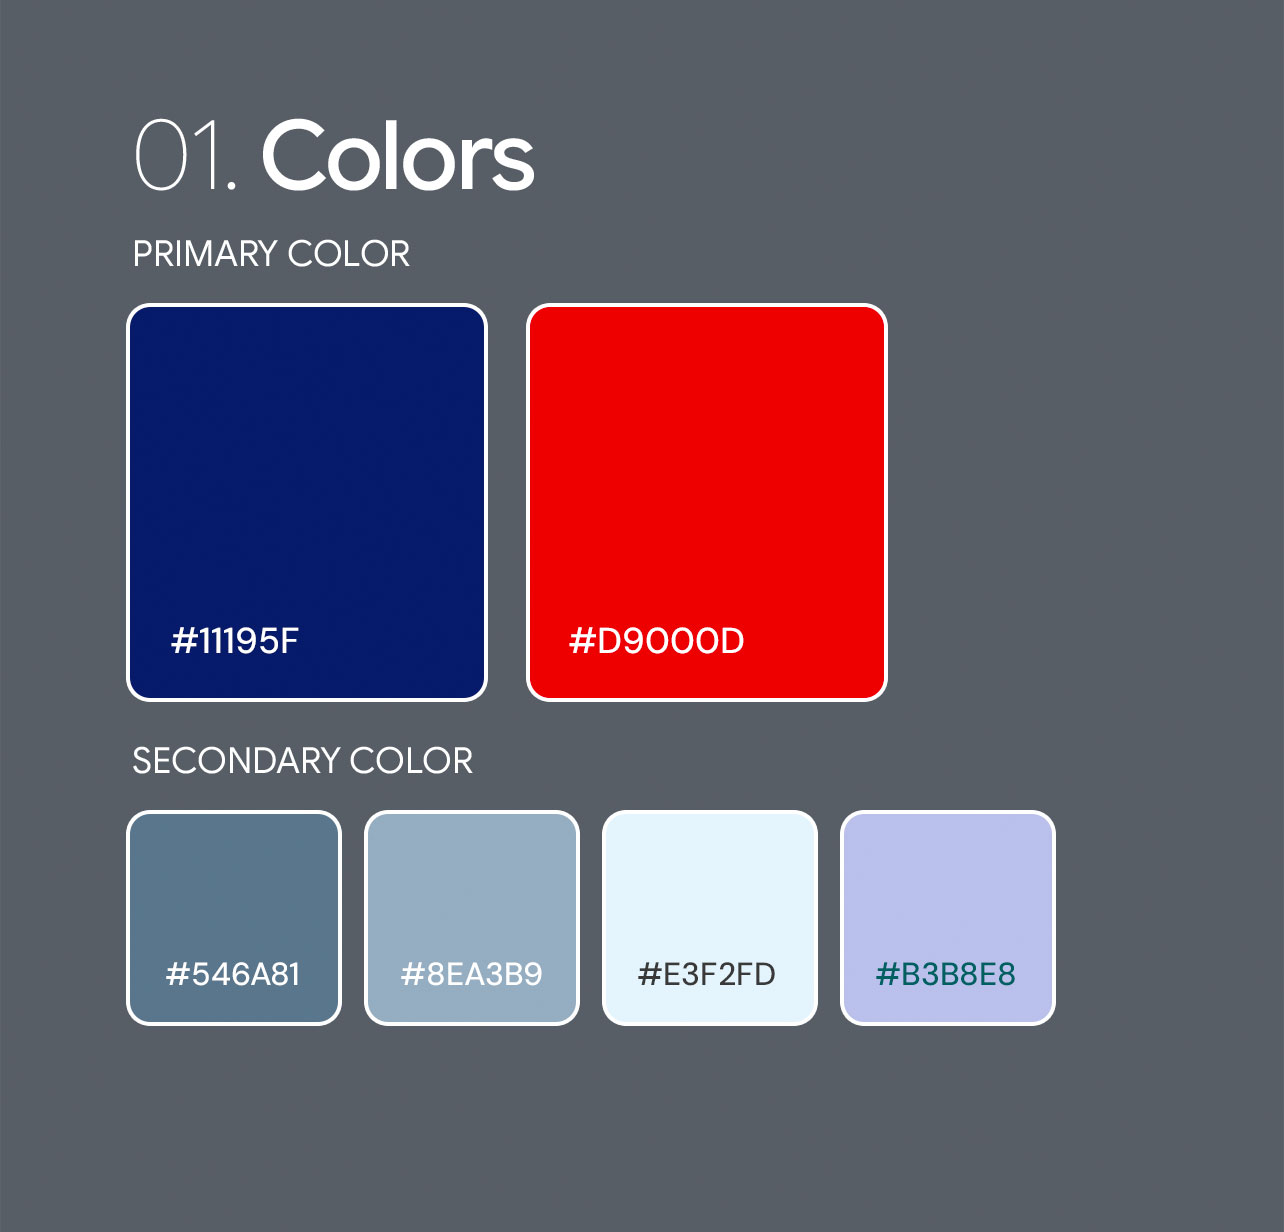
Style Guide

I developed a comprehensive design system that eliminated inconsistencies and cut down production time, allowing the team to focus on delivering a superior user experience.

THE

Visual Design

To me, Visual Design is more than just aesthetics—it’s a communication tool. I use typography, color theory, and spacing to create a clear visual hierarchy that guides the user’s eye to what matters most.

  • Get in touch
    Work Inquiries
    +91 99444 00361
  • Assistance hours:
    Monday – Friday
    10 am to 8 pm ISD
  • Post address
    10/A, Indira Gandhi Street,
    Sengeniammal Nagar, Orlean Pet
    Pondicherry – 605005. (INDIA)
  • Sign up for the newsletter